You may be wondering how you can combat and even profit from volatility in the market. MA RSI is a technical indicator that helps traders take trades confidently by providing them with short-term and long-term trading signals. It also indicates the dynamic support and resistance areas on a price chart.
This article will focus on what MA RSI is and why it’s so important for traders to set their scalping strategies. And finally, some implications of the MA RSI Strategy!
What is MA RSI
The MA RSI is a combination of two technical indicators: the moving average (MA) and the relative strength index (RSI). Like many indicators, MA RSI can be applied to a wide range of financial instruments. The purpose of this popular momentum oscillator is to generate buy signals when the price and RSI move above its average and sell signals when it falls below its own mean.
What is MA?
On the other hand, The Moving Average is a technical analysis tool used to help traders determine the direction of a trend. It also helps in determining the dynamic support and resistance.
What is the Relative Strength Index?
The Relative Strength Index, or RSI, is one of the most essential momentum oscillators for technical analysis allowing traders to grasp and utilize their trading tactics. For example, rsi value helps them in determining whether a price chart is overvalued or undervalued.
Formula for RSI
RSI = 100 – {100 / (1+ RS)}
Here RS = [(14 day Average of up closes) / (14 day average of down closes)]
We don’t have to calculate RSI for our Trading strategy. But I hope it’s now clear to you that RSI is a better version of the price average.
RSI indicator buy and sell signals
Relative Strength Index measures the strength of the buying and selling pressure within a stock price over a given time period.
For technical analysis, Traders commonly use a 14 period RSI to calculate its value. Meaning it shows historical data of price movement over those 14 periods and calculates how many times prices went from overbought to oversold or vice versa.
If the RSI indicator signal line falls under 30 level, then it is oversold, and if the line rises above 70, then it is considered to be in an overbought state. Therefore, many investors use this signal as a buying or selling opportunity depending on whether the RSI indicator value is below 30 or above 70, respectively.
RSI divergence
In technical analysis, RSI divergence indicates whether the price and RSI are moving in the same direction or not. If they’re diverging, this means there could be an upcoming trend reversal, so it’s good to pay attention when you see a divergence between them.
In other words, if the price goes up, but the RSI goes down, RSI divergence is called bearish divergence. If the price goes down but the RSI goes up, it’s a bullish divergence.
Setting Up indicator on the trading platform for MA RSI strategy
Moving averages and RSI are used to implement different strategies, but mostly it is related to trend following. So, the strategy can be implemented using various time frames on any platform. But we prefer to use it on a lower time frame like M15 or M30 for scalping on the MT4 platform.
This technique consists of two moving averages, with one faster than the other and crossing over the slower average once in a while depending on the market volatility.

Chart Moving Average settings
This strategy will use a 200 Linear weighted MA applied to the close as a long term moving average. On the other hand, we will use EMA 20 applied to the close as fast MA. The first crossing of the two averages gives us a buy signal and vice versa for sell.

Relative Strength Index (RSI) settings
The default RSI indicator setting is 14. An oversold level is usually drawn on the chart at level 30. On the other hand level, 70 provides an rsi overbought signal for a trader. But for this trading system, we will use 21 RSI. In addition, we will set three RSI levels on the indicator window – 30, 70, and 50.

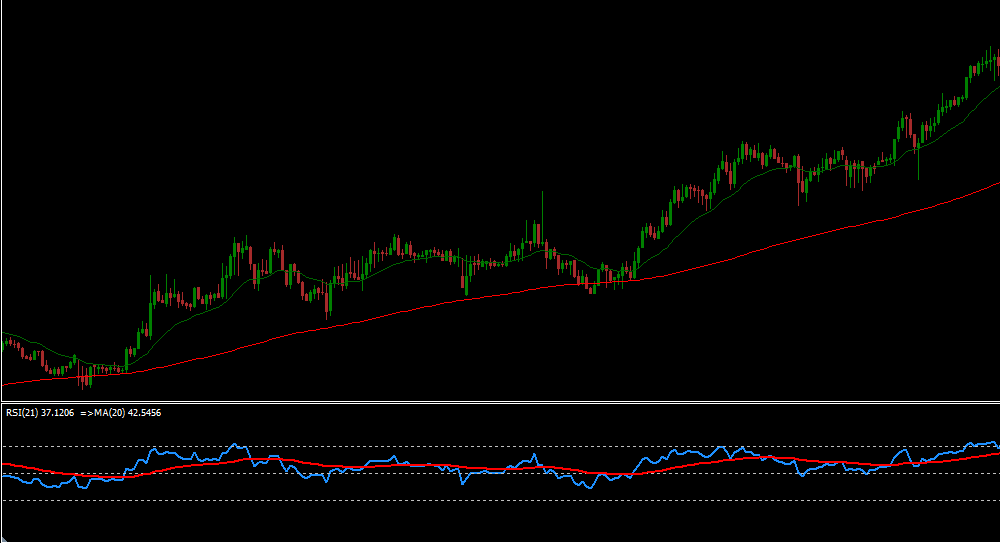
Moving Average Oscillator settings On RSI:
Now from the above chart window we will drag down the Moving Average Indicator and will put it on the RSI window. This time we will use 20 periods of smoothed Moving average applied to the First indicator’s data.

How to trade with MA RSI trading strategy?
The trading rules here are straightforward. We will first wait for a 200/20 Moving Average crossover on the M15 or M30 timeframes. Not only that, but we’ll sit back and wait for a full-body price candle to open and close above those moving averages.
So, For the sell signal, the 200 LMA will be on top, followed by a 50 EMA, and lastly, a full-body candle closes below it.
On the other hand, for the buy signal, we will wait until the 50 EMA goes above 200 LMA and the price candle opens and closes above the 50 EMA.
That’s our first confirmation for the trade setup. Now let’s have a look at the second setup.

The RSI signal line must cross the MA from the top and descend below the 50 levels for considering a sell signal. Conversely, the RSI signal line must cross over the MA from below and exceed 50 levels for a buy signal.
If all the conditions are met, you can take a buy or sell trade, depending on rsi reading the trade setup. But it’s always a good idea to use support and resistance levels, draw trend lines for downtrend or uptrend breakout, and finally consider price action to avoid a ranging market.
For greater accuracy, you may also verify the divergence (if any) to ensure that the trend is genuine using another popular momentum oscillator MACD. Like the relative strength index, Moving average convergence divergence (MACD), and Bollinger band oscillator are also widely used by scalpers to detect the divergence on the price chart.
This strategy is suitable for any timeframe, but it works best on M30 or M15 timeframes with a good price movement.
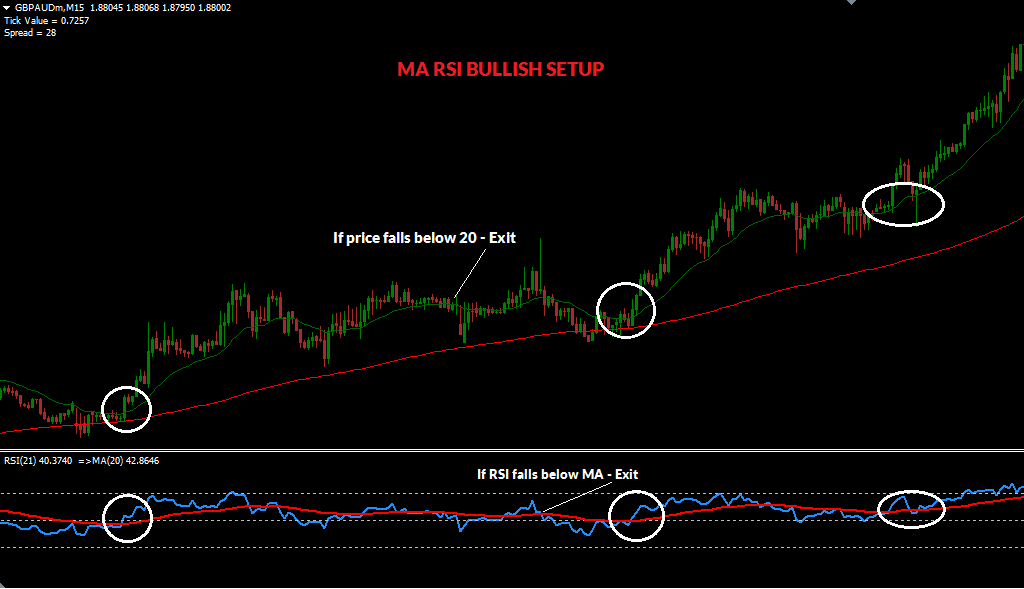
What will be My Exit Strategy?
It’s better not to hold a trade too long as this is a scalping strategy. You have the option of exiting your trade –
- On the 20/200 Moving Averages crossover.
- On a MA RSI opposite crossover,
- or whichever comes first.
Generally, after trade entry, I exit on MA RSI Crossover or if the RSI line reaches the overbought or oversold territory. And finally, I don’t hold that trade too long if I see any divergence formation against the trade.
Why is this MA RSI strategy so effective in volatile markets?
RSI is a great indicator to identify oversold and overbought conditions and price volatility. Many traders use this indicator to go short on RSI > 70 and long on RSI <= 30. However, what makes this strategy so effective is the addition of the moving average to this strategy.
Combining a short-term and long-term moving average on top of RSI is an excellent way to identify market reversals. Moreover, 200/20 MA acts as dynamic support and resistance levels as well as trend strength.
In addition to RSI and 21 Moving average crossovers considering 50 levels, we can make better trading decisions with less risk involved. This makes it easier for you to manage your trades in real-time.
Scalpers generally wait for the market volatility as they make entries and exit to trades too frequently. On the other hand, RSI is sensitive to market volatility, and using a moving average with it clears the trend direction very well.
And that’s why the MA RSI strategy is so effective in volatile markets and it is originally developed for scalpers.
What is the best time of day to use MA RSI trading strategy?
The best time to use this strategy is when you are patient. The market is not always volatile. So first, wait for the support and resistance line to break. It will ensure that you are not trading on the sideways market. Second, wait for the trade setup to form and avoid early trade entry. And finally, don’t do over-trading.
By the way, I prefer day trading and the London session to trade forex for its volatility.
What are the drawbacks of using the MA RSI trading strategy?
The first drawback is that it can be too sensitive. The MA RSI strategy will get you out of the market when there’s a big move. Either up or down, even if it doesn’t last for very long.
It may be better to wait and see what happens before getting out of your position because you don’t know how much more upside or downside potential there might still be after an initial large move.
And since the price could always go back in the other direction, buying at this low point to cover would result in a loss instead of just break-even as normal stop losses.
Another drawback is that this method does not consider volume flow which often leads to false signals caused by fake outs.
The normal MA RSI strategy will also not work in all types of markets. For example, it can be very effective when volatility is moderately good, but it’s less likely to catch the trend reversals that often occur during News events.
You can also add other momentum indicators with this method, such as ATR or Bollinger Bands which are designed to filter out false signals caused by market noise.
Backtesting the strategy will help you adapt to this system fast. And do not forget to use stop loss above the previous swing high or swing low.
Final Notes on MA RSI
- The ma RSI trading strategy is a technical analysis tool that uses the price of a security to predict its future movement.
- It’s based on three indicators – the rate of change, the average true range, and the momentum oscillator.
- By analyzing these three indicators together, traders can identify areas where there may be an opportunity for a profitable trade.
- Traders will use this information to find optimal exit points and place stop losses in order to minimize risk and maximize profits.
- This strategy also works well with other forms of analysis like fundamental analysis or sentiment analysis because it helps traders make decisions during periods when traditional methods are not as effective.
- And finally, this strategy can be applied across all time frames in many different ways but typically trades prefer it in shorter intervals along with their algorithmic trading strategy due to high volatility in markets.